Last month we looked at how much rents have risen across key US metro areas. With most cities seeing record high rents in the past 12 months, it's fair to say things have been pretty bleak.
This data was based on a quarterly report we put together, but we also do a separate set of monthly analyses, and this month's data paints a slightly different picture, both in New York and across the US as a whole.
The number of people looking for new rentals increased in July, compared to the month before. But summer is always busy in the rental market, so we'd expect that. The real key is to look not just at how many people are looking for somewhere to live, but to look at how many people are looking compared to the number of rooms available. That ratio is the key to understanding what's happening right now.
People looking vs rooms
The key numbers are these:
- The ratio of people looking for rooms, compared to rooms available across the whole of the US in July was 4.1 (that's 4.1 people looking for every room available)
- The ratio in New York was 6.2
But where it gets interesting is to look at how that's changed compared to July last year.
- In July 2022, the US ratio was 5.9
- In New York it was a massive 8.8
Here's why that's fallen in the space of a year.
Across the US, the number of people looking for rooms in July 2023, compared to July 2022 rose by 7.8%. However, the number of rooms available went up by 53.1%
In New York the number of people looking actually fell by 1.9%, while the number of rooms on offer rose by 39.4%
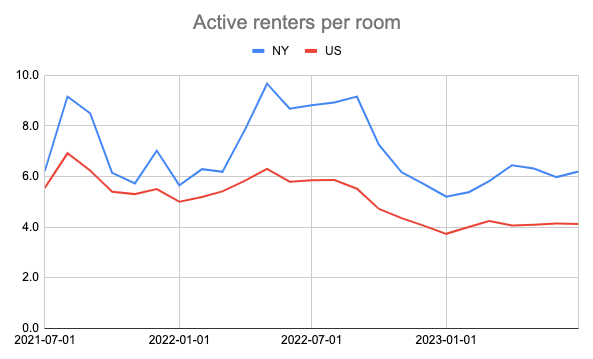
That means there's less competition for rooms now than at this point last year. This graph shows how that ratio has changed over the past 2 years.
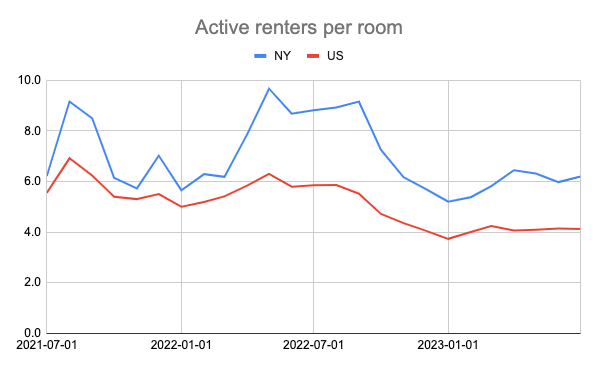
As you can see, we're well below the peaks of last summer, when the rental market really spiralled out of control, sending rents rocketing in most major cites.
How we calculate demand vs supply
It's useful to take a minute to explain why we look at the number like this.
If there are 100 rooms available and 200 people looking, that's a renters to rooms ratio of 2:1. However, it's possible that all 200 of those people might message one of the ads, leading that person to believe there are 200 people going for every room. You've probably seen stats in some reports suggesting there are 40 or 50 people competing for every rental, which is a little misleading. That's why we look at active renters per room to get a real sense of what's happening.
In summary
Things are hotting up again, as they always do at this time of year, but they're starting from a more balanced place than they were in July 2022.